
Bitcoin remained resilient on April 28, 2025, with its price coasting along at $95,489, a market cap of $1.89 trillion, and a 24-hour trade volume of $21.47 billion. The cryptocurrency traded within an intraday range of $92,953 to $95,857, showcasing tight consolidation beneath a key resistance zone.
Bitcoin
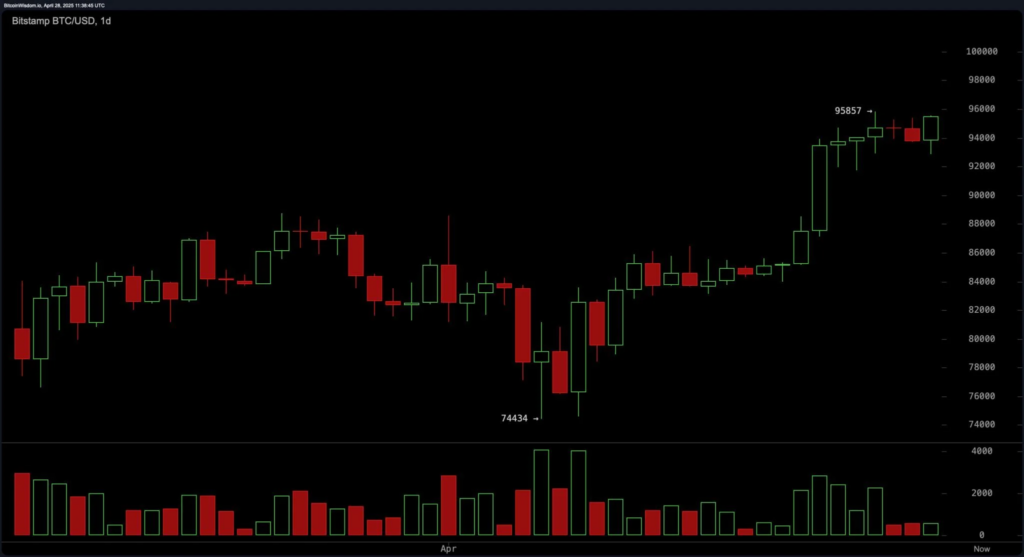
Bitcoin’s daily chart looks solid, climbing from a low of $74,434 to a recent high near $95,857. Volume spiked during the rise, proving real buying interest, though it’s dipped a bit lately. We’re seeing tiny red candles at the top, hinting at a breather or consolidation. Key support sits around $84,000-$86,000, while resistance is locked in at $95,000-$96,000. Watch for dips to $88,000-$90,000 for smart entry points if the bullish vibe sticks.
BTC/USD 1D Chart on Bitstamp
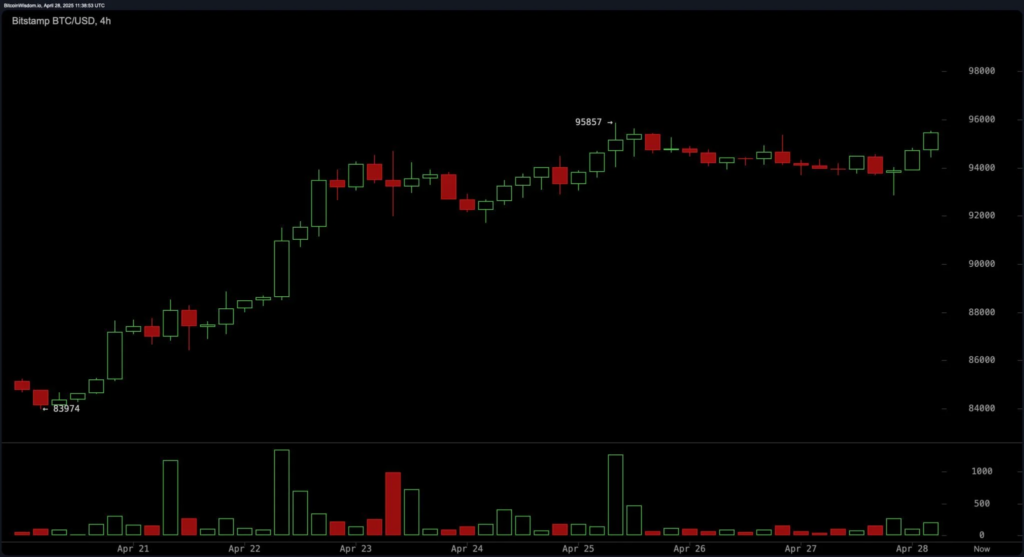
On the 4-hour chart, Bitcoin surged from $83,974 to $95,857, then settled into a sideways groove. Volume’s easing off, suggesting a possible distribution phase. Lower highs are popping up after the peak, signaling fading momentum—but no full reversal yet. A clean break above $96,000 with solid volume could kick off another rally. A drop to $93,000 might offer a good re-entry spot, but falling below $92,000 could mean a bigger pullback.
BTC/USD 4H Chart on Bitstamp
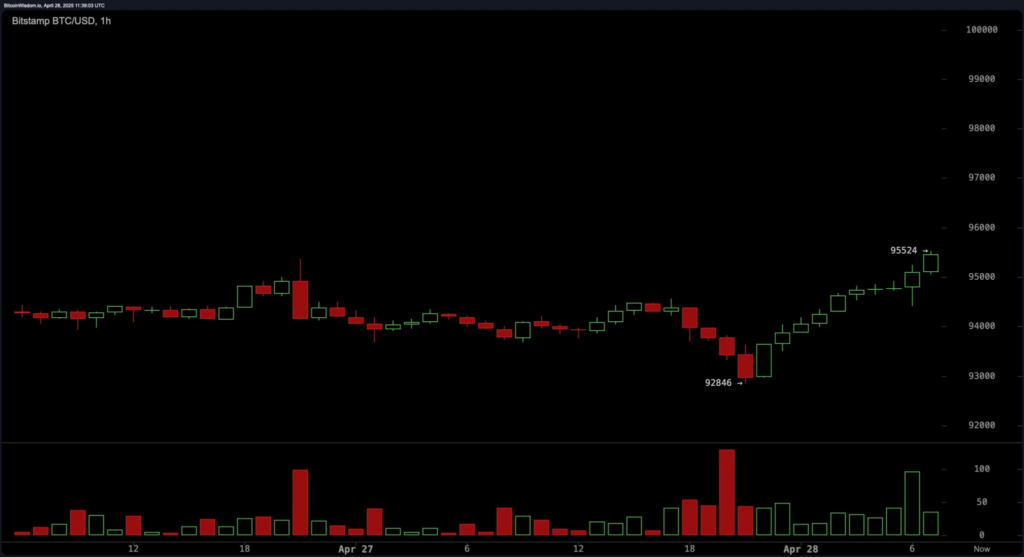
The 1-hour chart shows a bounce from $92,846 to $95,477, with higher lows hinting at a mini-uptrend within this range. Green volume jumps back the rebound, giving bulls some confidence. Breaking $95,500 could push it back to $95,857-$96,000. If it gets rejected here, expect quick profit-taking—set stop-losses just below $94,300 to dodge fake-outs.
BTC/USD 1H Chart on Bitstamp
Oscillators are sending mixed vibes. The RSI at 69 and Stochastic at 90 are neutral, while the ADX at 28 and CCI at 108 (sell signal) suggest caution. On the flip side, the momentum oscillator at 10,921 and MACD at 2,963 lean bullish. It’s a wait-and-see game—more volume could spark a fresh bullish push.
Moving averages are cheering for the bulls. All key EMAs and SMAs (10, 20, 30, 50, 100, 200 periods) are bullish, with the 10 EMA at $92,059 and 10 SMA at $91,753, both well below today’s price. As long as Bitcoin stays above these, the trend’s upward—but keep an eye on that resistance zone!
Bullish Outlook:
If Bitcoin smashes through $96,500 with strong volume, get ready for a run toward $98,000-$100,000. The solid moving average support and bullish indicators make this a likely move.
Bearish Outlook:
If Bitcoin can’t crack $96,000 and slips below $92,000, a deeper drop to $88,000 or even $84,000 could hit. Neutral oscillators and signs of fatigue near the top mean a cautious approach is smart right now.
FAQ: Bitcoin Price Breakout
Why is Bitcoin stuck near $96,000?
Bitcoin’s hitting a big resistance zone at $95,000-$96,000. It’s been consolidating here ‘cause sellers are stepping in, but bulls are still fighting to break through with enough volume.
Should I buy Bitcoin now?
It’s tricky! The trend’s bullish, but we’re at a key resistance. You might wait for a dip to $93,000 or a confirmed breakout above $96,500. Always do your own research—crypto’s wild!
What if Bitcoin drops below $92,000?
A drop below $92,000 could mean a bigger pullback, maybe to $88,000 or $84,000. That’s where bears might take control, so set stop-losses if you’re trading.
How do I track Bitcoin’s price live?
Check out CoinMarketCap or CoinDesk for real-time prices. You can also follow Bitstamp charts or set alerts on trading apps like Binance.
- Market Strategies for 2025: Navigating the Digital Landscape
- Satoshi’s Vision at 100: Will Bitcoin Remain Trustless by 2129?
- From Small Starts to Billionaires: Entrepreneurs Who Built Empires
- 🚀 We see the Bitcoin industry growing from $2 trillion to $200 trillion in the next 21 years.
- AI in Gaming: Balancing Innovation with Ethical Considerations
Proudly powered by WordPress